使用Prometheus监控Spring Boot服务监控状态并预警

当我们开发了一个Web Api之类的服务上线后,总以为可以松一口,可以舒心的撸几把游戏,但是事与愿违,有时候服务突然就挖塌了,而且还不自知,还在开开心心的排位赛,此时上级领导、客户、客户的领导都来慰问、鼓励,给你加油、打气。当然这只是一种情况,但足以看出服务监控还是很重要的。


服务高可用一般就是监控+冗余,在一个应用挂掉之后,其他应用继续提供服务,并给运维及时告警,快速恢复挂掉的节点,当然,我们小公司的各种资源都是有限的,所以需要找一个部署快、成本低的监控系统,这里就找到一个开源、流行的监控系统Prometheus,现在,我们就搞一下咯。
这里需要介绍几个要用到的Prometheus组件:

  • Prometheus:服务端收集、存储数据
  • Exporter:本地服务暴露metricsPrometheus
  • AlertManager:接收预警信息并告警

Docker安装Prometheus

创建Prometheus配置和规则文件

首先我们需要配置好我们的Prometheus,配置方式可以去https://prometheus.io/docs/prometheus/latest/configuration/configuration/查看,这里还是需要对一些参数有些了解:

1
2
3
4
5
6
7
8
9
10
11
12
13
14
15
16
17
18
19
20
21
22
23
24
25
26
27
28
29
30
31
32
33
34
35
36
37
38
39
40
41
42
global:
# How frequently to scrape targets by default.
[ scrape_interval: <duration> | default = 1m ]

# How long until a scrape request times out.
[ scrape_timeout: <duration> | default = 10s ]

# How frequently to evaluate rules.
[ evaluation_interval: <duration> | default = 1m ]

# The labels to add to any time series or alerts when communicating with
# external systems (federation, remote storage, Alertmanager).
external_labels:
[ <labelname>: <labelvalue> ... ]

# File to which PromQL queries are logged.
# Reloading the configuration will reopen the file.
[ query_log_file: <string> ]

# Rule files specifies a list of globs. Rules and alerts are read from
# all matching files.
rule_files:
[ - <filepath_glob> ... ]

# A list of scrape configurations.
scrape_configs:
[ - <scrape_config> ... ]

# Alerting specifies settings related to the Alertmanager.
alerting:
alert_relabel_configs:
[ - <relabel_config> ... ]
alertmanagers:
[ - <alertmanager_config> ... ]

# Settings related to the remote write feature.
remote_write:
[ - <remote_write> ... ]

# Settings related to the remote read feature.
remote_read:
[ - <remote_read> ... ]

现在我们开始新建一个prometheus.yml并做如下配置:

1
2
3
4
5
6
7
8
9
10
11
12
13
14
15
global:
scrape_interval: 30s
evaluation_interval: 30s
alerting: #配置AlertManager的地址
alertmanagers:
- static_configs:
- targets: [ '182.61.35.33:9093']
scrape_configs:
- job_name: 'spring boot'
scrape_interval: 5s
metrics_path: '/actuator/prometheus'
static_configs:
- targets: ['182.61.35.33:8080']
labels:
appname: 'app'

一个job下面可以配置多个应用,即static_configs,现在我们就用docker来运行一个prometheus

1
2
3
docker run -d -p 9090:9090 --name=prometheus \
-v /root/prometheus/:/etc/prometheus/ \
prom/prometheus

这时候就可以看到这样的界面了

但是我们的AlertManager和应用都还没启动,接下来,我们慢慢的完成

Spring Boot接入Prometheus

新建项目

这里我们新建一个应用,并引入一下几个包

1
2
3
4
5
6
7
8
9
10
11
12
13
14
<dependency>
<groupId>org.springframework.boot</groupId>
<artifactId>spring-boot-starter-web</artifactId>
</dependency>
<dependency>
<groupId>org.springframework.boot</groupId>
<artifactId>spring-boot-starter-actuator</artifactId>
</dependency>
<!-- https://mvnrepository.com/artifact/io.micrometer/micrometer-registry-prometheus -->
<dependency>
<groupId>io.micrometer</groupId>
<artifactId>micrometer-registry-prometheus</artifactId>
<version>1.3.5</version>
</dependency>

配置prometheus metrics

在配置文件中作出以下配置

1
2
3
4
5
6
7
8
9
10
management:
metrics:
export:
prometheus:
enabled: true
endpoints:
web:
exposure:
include: health,info,env,prometheus,metrics,httptrace,threaddump,heapdump

启动spring boot程序,访问/actuator/prometheus路径,可以得到一下信息

1
2
3
4
5
6
7
8
9
10
11
12
13
14
15
16
17
18
19
20
21
22
23
24
25
26
27
28
29
30
31
32
33
34
35
36
37
38
39
40
41
42
43
44
45
46
47
48
49
50
51
52
53
54
55
56
57
58
59
60
61
62
63
64
65
66
67
68
69
70
71
72
73
74
75
76
77
78
79
80
81
82
83
84
85
86
87
88
89
90
91
92
93
94
95
96
97
98
99
100
101
102
103
104
105
106
107
108
109
110
111
112
113
114
115
116
117
118
119
120
121
# HELP jvm_threads_states_threads The current number of threads having NEW state
# TYPE jvm_threads_states_threads gauge
jvm_threads_states_threads{state="runnable",} 11.0
jvm_threads_states_threads{state="blocked",} 0.0
jvm_threads_states_threads{state="waiting",} 12.0
jvm_threads_states_threads{state="timed-waiting",} 3.0
jvm_threads_states_threads{state="new",} 0.0
jvm_threads_states_threads{state="terminated",} 0.0
# HELP jvm_gc_pause_seconds Time spent in GC pause
# TYPE jvm_gc_pause_seconds summary
jvm_gc_pause_seconds_count{action="end of major GC",cause="Metadata GC Threshold",} 1.0
jvm_gc_pause_seconds_sum{action="end of major GC",cause="Metadata GC Threshold",} 0.053
jvm_gc_pause_seconds_count{action="end of minor GC",cause="Metadata GC Threshold",} 1.0
jvm_gc_pause_seconds_sum{action="end of minor GC",cause="Metadata GC Threshold",} 0.008
# HELP jvm_gc_pause_seconds_max Time spent in GC pause
# TYPE jvm_gc_pause_seconds_max gauge
jvm_gc_pause_seconds_max{action="end of major GC",cause="Metadata GC Threshold",} 0.053
jvm_gc_pause_seconds_max{action="end of minor GC",cause="Metadata GC Threshold",} 0.008
# HELP jvm_buffer_memory_used_bytes An estimate of the memory that the Java virtual machine is using for this buffer pool
# TYPE jvm_buffer_memory_used_bytes gauge
jvm_buffer_memory_used_bytes{id="direct",} 8192.0
jvm_buffer_memory_used_bytes{id="mapped",} 0.0
# HELP tomcat_sessions_active_max_sessions
# TYPE tomcat_sessions_active_max_sessions gauge
tomcat_sessions_active_max_sessions 0.0
# HELP process_uptime_seconds The uptime of the Java virtual machine
# TYPE process_uptime_seconds gauge
process_uptime_seconds 14.293
# HELP logback_events_total Number of error level events that made it to the logs
# TYPE logback_events_total counter
logback_events_total{level="warn",} 0.0
logback_events_total{level="debug",} 0.0
logback_events_total{level="error",} 0.0
logback_events_total{level="trace",} 0.0
logback_events_total{level="info",} 8.0
# HELP jvm_gc_memory_allocated_bytes_total Incremented for an increase in the size of the young generation memory pool after one GC to before the next
# TYPE jvm_gc_memory_allocated_bytes_total counter
jvm_gc_memory_allocated_bytes_total 7.6557328E7
# HELP jvm_gc_live_data_size_bytes Size of old generation memory pool after a full GC
# TYPE jvm_gc_live_data_size_bytes gauge
jvm_gc_live_data_size_bytes 1.6091968E7
# HELP jvm_buffer_total_capacity_bytes An estimate of the total capacity of the buffers in this pool
# TYPE jvm_buffer_total_capacity_bytes gauge
jvm_buffer_total_capacity_bytes{id="direct",} 8192.0
jvm_buffer_total_capacity_bytes{id="mapped",} 0.0
# HELP process_cpu_usage The "recent cpu usage" for the Java Virtual Machine process
# TYPE process_cpu_usage gauge
process_cpu_usage 0.015306358354323044
# HELP jvm_gc_memory_promoted_bytes_total Count of positive increases in the size of the old generation memory pool before GC to after GC
# TYPE jvm_gc_memory_promoted_bytes_total counter
jvm_gc_memory_promoted_bytes_total 6929264.0
# HELP jvm_threads_peak_threads The peak live thread count since the Java virtual machine started or peak was reset
# TYPE jvm_threads_peak_threads gauge
jvm_threads_peak_threads 28.0
# HELP jvm_memory_used_bytes The amount of used memory
# TYPE jvm_memory_used_bytes gauge
jvm_memory_used_bytes{area="heap",id="PS Survivor Space",} 0.0
jvm_memory_used_bytes{area="heap",id="PS Old Gen",} 1.6091968E7
jvm_memory_used_bytes{area="heap",id="PS Eden Space",} 1.6104544E7
jvm_memory_used_bytes{area="nonheap",id="Metaspace",} 3.5507288E7
jvm_memory_used_bytes{area="nonheap",id="Code Cache",} 6837440.0
jvm_memory_used_bytes{area="nonheap",id="Compressed Class Space",} 4960320.0
# HELP system_cpu_usage The "recent cpu usage" for the whole system
# TYPE system_cpu_usage gauge
system_cpu_usage 1.0
# HELP tomcat_sessions_active_current_sessions
# TYPE tomcat_sessions_active_current_sessions gauge
tomcat_sessions_active_current_sessions 0.0
# HELP jvm_gc_max_data_size_bytes Max size of old generation memory pool
# TYPE jvm_gc_max_data_size_bytes gauge
jvm_gc_max_data_size_bytes 1.332740096E9
# HELP jvm_memory_committed_bytes The amount of memory in bytes that is committed for the Java virtual machine to use
# TYPE jvm_memory_committed_bytes gauge
jvm_memory_committed_bytes{area="heap",id="PS Survivor Space",} 1.1010048E7
jvm_memory_committed_bytes{area="heap",id="PS Old Gen",} 7.8118912E7
jvm_memory_committed_bytes{area="heap",id="PS Eden Space",} 1.00139008E8
jvm_memory_committed_bytes{area="nonheap",id="Metaspace",} 3.8273024E7
jvm_memory_committed_bytes{area="nonheap",id="Code Cache",} 6881280.0
jvm_memory_committed_bytes{area="nonheap",id="Compressed Class Space",} 5505024.0
# HELP jvm_classes_unloaded_classes_total The total number of classes unloaded since the Java virtual machine has started execution
# TYPE jvm_classes_unloaded_classes_total counter
jvm_classes_unloaded_classes_total 7.0
# HELP jvm_threads_daemon_threads The current number of live daemon threads
# TYPE jvm_threads_daemon_threads gauge
jvm_threads_daemon_threads 22.0
# HELP tomcat_sessions_alive_max_seconds
# TYPE tomcat_sessions_alive_max_seconds gauge
tomcat_sessions_alive_max_seconds 0.0
# HELP jvm_threads_live_threads The current number of live threads including both daemon and non-daemon threads
# TYPE jvm_threads_live_threads gauge
jvm_threads_live_threads 26.0
# HELP tomcat_sessions_created_sessions_total
# TYPE tomcat_sessions_created_sessions_total counter
tomcat_sessions_created_sessions_total 0.0
# HELP jvm_memory_max_bytes The maximum amount of memory in bytes that can be used for memory management
# TYPE jvm_memory_max_bytes gauge
jvm_memory_max_bytes{area="heap",id="PS Survivor Space",} 1.1010048E7
jvm_memory_max_bytes{area="heap",id="PS Old Gen",} 1.332740096E9
jvm_memory_max_bytes{area="heap",id="PS Eden Space",} 6.422528E8
jvm_memory_max_bytes{area="nonheap",id="Metaspace",} -1.0
jvm_memory_max_bytes{area="nonheap",id="Code Cache",} 2.5165824E8
jvm_memory_max_bytes{area="nonheap",id="Compressed Class Space",} 1.073741824E9
# HELP tomcat_sessions_rejected_sessions_total
# TYPE tomcat_sessions_rejected_sessions_total counter
tomcat_sessions_rejected_sessions_total 0.0
# HELP process_start_time_seconds Start time of the process since unix epoch.
# TYPE process_start_time_seconds gauge
process_start_time_seconds 1.583576824548E9
# HELP system_cpu_count The number of processors available to the Java virtual machine
# TYPE system_cpu_count gauge
system_cpu_count 8.0
# HELP jvm_buffer_count_buffers An estimate of the number of buffers in the pool
# TYPE jvm_buffer_count_buffers gauge
jvm_buffer_count_buffers{id="direct",} 1.0
jvm_buffer_count_buffers{id="mapped",} 0.0
# HELP tomcat_sessions_expired_sessions_total
# TYPE tomcat_sessions_expired_sessions_total counter
tomcat_sessions_expired_sessions_total 0.0
# HELP jvm_classes_loaded_classes The number of classes that are currently loaded in the Java virtual machine
# TYPE jvm_classes_loaded_classes gauge
jvm_classes_loaded_classes 7386.0

打包镜像

先编辑一个简单的Dockerfile文件

1
2
3
FROM openjdk:8-jdk-alpine
COPY prometheus-0.0.1-SNAPSHOT.jar app.jar
ENTRYPOINT ["java","-jar","/app.jar"]

接下就是打包成镜像

1
2
3
4
5
6
7
8
9
10
11
12
13
14
15
16
17
18
19
[root@instance-p0a4erj8 spring]# docker build -t springdemo:v1 . 
Sending build context to Docker daemon 21.18MB
Step 1/3 : FROM openjdk:8-jdk-alpine
8-jdk-alpine: Pulling from library/openjdk
e7c96db7181b: Already exists
f910a506b6cb: Pull complete
c2274a1a0e27: Pull complete
Digest: sha256:94792824df2df33402f201713f932b58cb9de94a0cd524164a0f2283343547b3
Status: Downloaded newer image for openjdk:8-jdk-alpine
---> a3562aa0b991
Step 2/3 : COPY prometheus-0.0.1-SNAPSHOT.jar app.jar
---> e39e208a176c
Step 3/3 : ENTRYPOINT ["java","-jar","/app.jar"]
---> Running in c23af9dfc64a
Removing intermediate container c23af9dfc64a
---> 4cd9c1315046
Successfully built 4cd9c1315046
Successfully tagged springdemo:v1

现在我们来运行一下docker run -d -p 8080:8080 springdemo:v1

1
2
3
4
5
6
7
8
9
10
11
12
13
14
15
16
17
18
19
20
21
22
23
24

. ____ _ __ _ _
/\\ / ___'_ __ _ _(_)_ __ __ _ \ \ \ \
( ( )\___ | '_ | '_| | '_ \/ _` | \ \ \ \
\\/ ___)| |_)| | | | | || (_| | ) ) ) )
' |____| .__|_| |_|_| |_\__, | / / / /
=========|_|==============|___/=/_/_/_/
:: Spring Boot :: (v2.2.5.RELEASE)

2020-03-07 09:50:23.711 INFO 1 --- [ main] c.e.prometheus.PrometheusApplication : Starting PrometheusApplication v0.0.1-SNAPSHOT on 67ef3675d196 with PID 1 (/app.jar started by root in /)
2020-03-07 09:50:23.729 INFO 1 --- [ main] c.e.prometheus.PrometheusApplication : No active profile set, falling back to default profiles: default
2020-03-07 09:50:28.317 INFO 1 --- [ main] o.s.b.w.embedded.tomcat.TomcatWebServer : Tomcat initialized with port(s): 8080 (http)
2020-03-07 09:50:28.392 INFO 1 --- [ main] o.apache.catalina.core.StandardService : Starting service [Tomcat]
2020-03-07 09:50:28.393 INFO 1 --- [ main] org.apache.catalina.core.StandardEngine : Starting Servlet engine: [Apache Tomcat/9.0.31]
2020-03-07 09:50:28.674 INFO 1 --- [ main] o.a.c.c.C.[Tomcat].[localhost].[/] : Initializing Spring embedded WebApplicationContext
2020-03-07 09:50:28.675 INFO 1 --- [ main] o.s.web.context.ContextLoader : Root WebApplicationContext: initialization completed in 4621 ms
2020-03-07 09:50:29.755 INFO 1 --- [ main] o.s.s.concurrent.ThreadPoolTaskExecutor : Initializing ExecutorService 'applicationTaskExecutor'
2020-03-07 09:50:30.975 INFO 1 --- [ main] o.s.b.a.e.web.EndpointLinksResolver : Exposing 14 endpoint(s) beneath base path '/actuator'
2020-03-07 09:50:31.262 INFO 1 --- [ main] o.s.b.w.embedded.tomcat.TomcatWebServer : Tomcat started on port(s): 8080 (http) with context path ''
2020-03-07 09:50:31.294 INFO 1 --- [ main] c.e.prometheus.PrometheusApplication : Started PrometheusApplication in 10.981 seconds (JVM running for 15.956)
2020-03-07 09:50:48.347 INFO 1 --- [nio-8080-exec-1] o.a.c.c.C.[Tomcat].[localhost].[/] : Initializing Spring DispatcherServlet 'dispatcherServlet'
2020-03-07 09:50:48.347 INFO 1 --- [nio-8080-exec-1] o.s.web.servlet.DispatcherServlet : Initializing Servlet 'dispatcherServlet'
2020-03-07 09:50:48.368 INFO 1 --- [nio-8080-exec-1] o.s.web.servlet.DispatcherServlet : Completed initialization in 21 ms

好啦,现在程序运行起来了,这时候我们去prometheus看看

我们再把刚才启动的docker给停掉,

可以看到状态发生了变化,接下来我们再继续配置AlertManager,使其能够在服务挂掉的时候,自动提醒。

安装AlertManager

AlertManager支持多种提醒方式,这里我暂时只配置邮件方式提醒。首先需要新建一个配置文件

1
2
3
4
5
6
7
8
9
10
11
12
13
14
global:
smtp_smarthost: 'smtp.163.com:25'
smtp_from: 'wmymtx@163.com'
smtp_auth_username: 'wmymtx@163.com'
smtp_auth_password: 'aaaaaaaa'

route:
group_interval: 1m #当第一个报警发送后,等待'group_interval'时间来发送新的一组报警信息
repeat_interval: 1m # 如果一个报警信息已经发送成功了,等待'repeat_interval'时间来重新发送他们
receiver: 'mail-receiver'
receivers:
- name: 'mail-receiver'
email_configs:
- to: '326076105@qq.com'

现在,我们基于Docker来启动AlertManager

1
2
3
4
5
6
7
8
9
10
11
12
13
14
docker run -d -p 9093:9093 --name alertmanager  -v /root/prometheus/alertmanager.yml:/etc/alertmanager/alertmanager.yml prom/alertmanager


[root@instance-p0a4erj8 ~]# docker logs ac65138c1c8b
level=info ts=2020-03-08T02:53:25.577Z caller=main.go:231 msg="Starting Alertmanager" version="(version=0.20.0, branch=HEAD, revision=f74be0400a6243d10bb53812d6fa408ad71ff32d)"
level=info ts=2020-03-08T02:53:25.577Z caller=main.go:232 build_context="(go=go1.13.5, user=root@00c3106655f8, date=20191211-14:13:14)"
level=info ts=2020-03-08T02:53:25.578Z caller=cluster.go:161 component=cluster msg="setting advertise address explicitly" addr=172.17.0.10 port=9094
level=info ts=2020-03-08T02:53:25.581Z caller=cluster.go:623 component=cluster msg="Waiting for gossip to settle..." interval=2s
level=info ts=2020-03-08T02:53:25.621Z caller=coordinator.go:119 component=configuration msg="Loading configuration file" file=/etc/alertmanager/alertmanager.yml
level=info ts=2020-03-08T02:53:25.622Z caller=coordinator.go:131 component=configuration msg="Completed loading of configuration file" file=/etc/alertmanager/alertmanager.yml
level=info ts=2020-03-08T02:53:25.626Z caller=main.go:497 msg=Listening address=:9093
level=info ts=2020-03-08T02:53:27.581Z caller=cluster.go:648 component=cluster msg="gossip not settled" polls=0 before=0 now=1 elapsed=2.000163621s
level=info ts=2020-03-08T02:53:35.582Z caller=cluster.go:640 component=cluster msg="gossip settled; proceeding" elapsed=10.001131157s

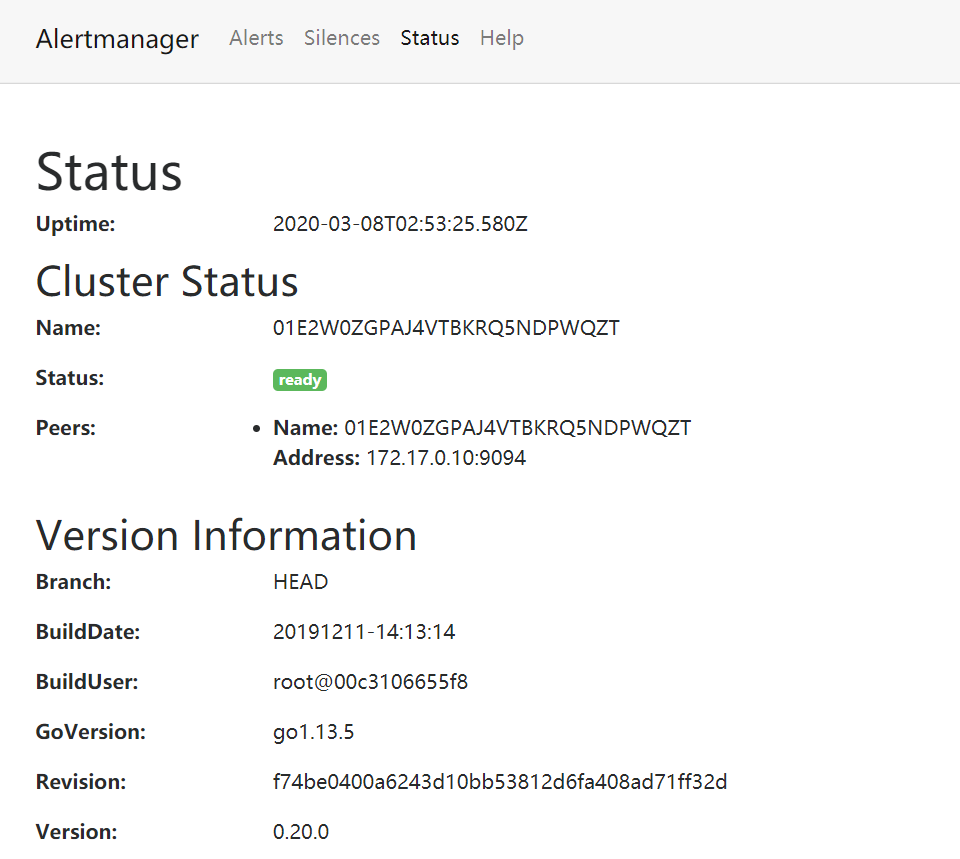
现在访问9093端口可以看到这样的界面

这里,我们再创建一个告警规则的配置文件

1
2
3
4
5
6
7
8
groups:
- name: alert-rule
rules:
- alert: HttpMonitor
expr: sum(up{job="spring boot"}) == 0
for: 1m
labels:
severity: critical

在我们的prometheus.yml加入预警规则

1
2
rule_files:
- "alert_rules.yml"

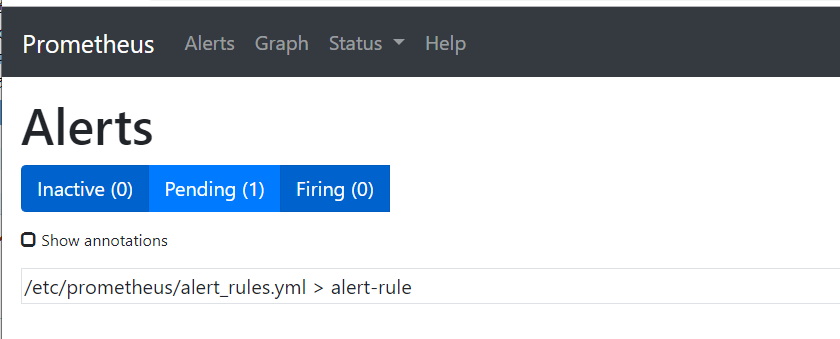
这时候重启prometheusdocker,就可以再Alerts看到相关信息,

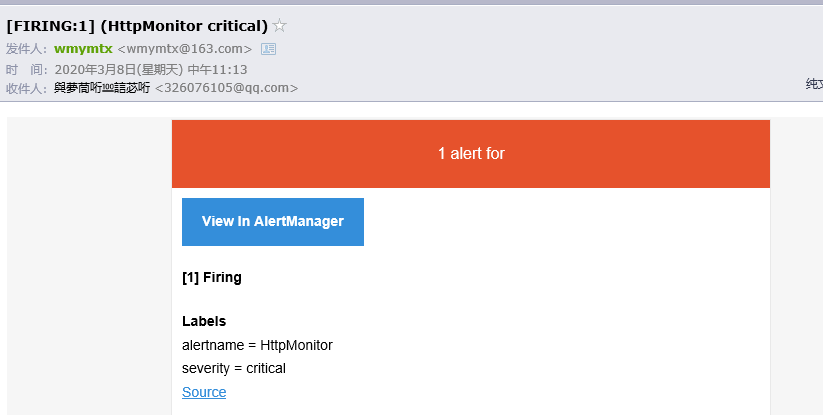
这时候停掉我们的Spring Boot服务等一会儿就可以收到邮件提醒了

这里暂时告一段落吧,后面我们再分享深入使用prometheus

使用Prometheus监控Spring Boot服务监控状态并预警

https://blogs.52fx.biz/posts/3048099505.html

作者

eyiadmin

发布于

2020-03-07

更新于

2024-05-31

许可协议

评论